Track
Back Office
Duration
30 hours
Skill Level
Advanced
Language
English
About this Course
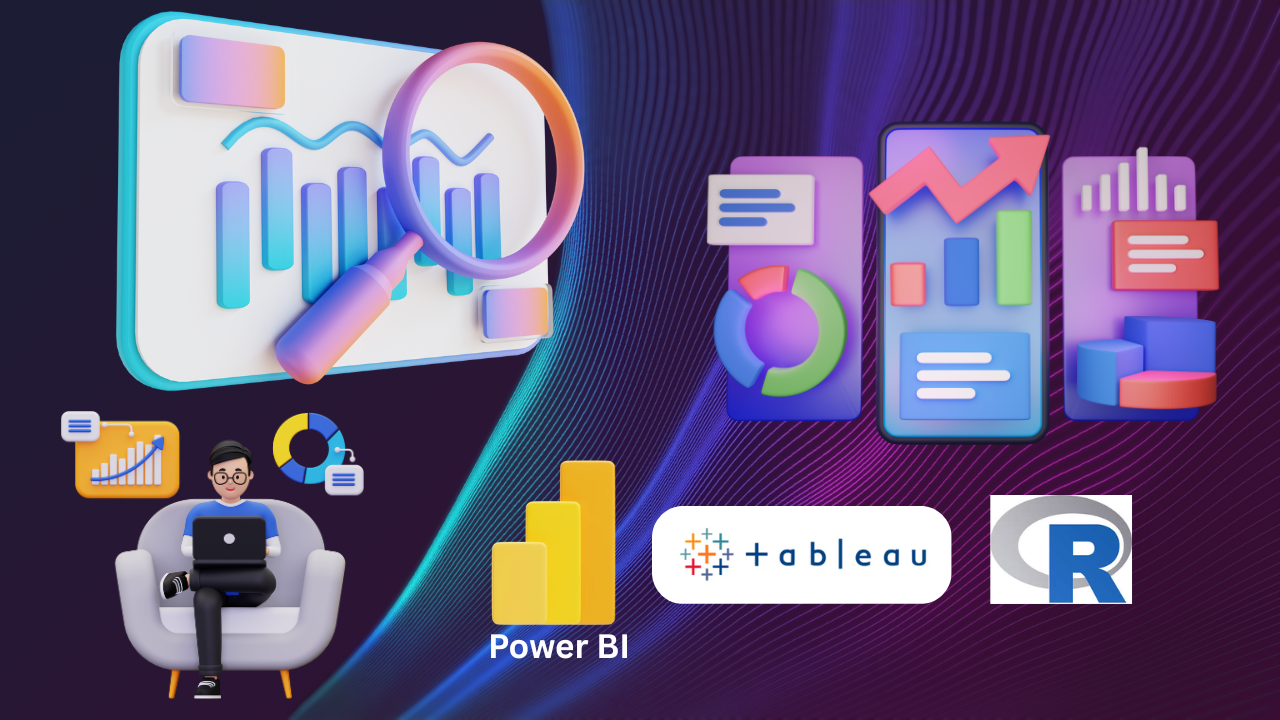
Learn to create impactful data visualizations and automate repetitive tasks. Improve data communication and workflow efficiency.
Learning Mode: Learn at ALC or at Home
Detailed Course Curriculum
Hands-on module breakdown aligned with MKCL production standards and industry requirements.
- Importance of data visualization
- Benefits of effective data visualization
- Overview of data visualization techniques (e.g., charts, graphs, maps)
- Choosing the right visualization for different types of data
- Introduction to data visualization tools (e.g., Tableau, Power BI, Python libraries like Matplotlib and Seaborn)
- Hands-on exploration of visualization tools
- Interactive visualizations
- Dashboard design principles
- Storytelling with data
- Importance of automation in data management
- Overview of automation tools and techniques
- Data extraction and transformation automation
- Workflow automation using scripting and macros
- Automation through APIs and integrations
- Hands-on exercises using automation tools (e.g., Python scripting, Microsoft Excel macros)
- Automating data visualization workflows
- Embedding visualizations in automated reports and dashboards
- Design principles for effective data visualization
- Best practices for automation implementation and maintenance
- Analyzing real-world case studies and examples
- Applying data visualization and automation strategies to practical scenarios
Eligibility Criteria
• Basic knowledge of computers and keen desire to build skills in this field.
• Open to students, job seekers, and working professionals.
• Open to students, job seekers, and working professionals.
Official Certification
• Official MKCL KLiC Certificate upon successful completion of the course and evaluations.
Work-Centric Learning Approach
• Step 1: Learners are given an overview of the course and its connection to life and work
• Step 2: Learners are exposed to the specific tool(s) used in the course through the various real-life applications of the tool(s).
• Step 3: Learners are acquainted with the careers and the hierarchy of roles they can perform at workplaces after attaining increasing levels of mastery over the tool(s).
• Step 4: Learners are acquainted with the architecture of the tool or tool map so as to appreciate various parts of the tool, their functions, utility and inter-relations.
• Step 5: Learners are exposed to simple application development methodology by using the tool at the beginner’s level.
• Step 6: Learners perform the differential skills related to the use of the tool to improve the given ready-made industry-standard outputs.
• Step 7: Learners are engaged in appreciation of real-life case studies developed by the experts.
• Step 8: Learners are encouraged to proceed from appreciation to imitation of the experts.
• Step 9: After the imitation experience, they are required to improve the expert’s outputs so that they proceed from mere imitation to emulation.
• Step 10: Emulation is taken a level further from working with differential skills towards the visualization and creation of a complete output according to the requirements provided. (Long Assignments)
• Step 11: Understanding the requirements, communicating one’s own thoughts and presenting are important skills required in facing an interview for securing a work order/job. For instilling these skills, learners are presented with various subject-specific technical as well as HR-oriented questions and encouraged to answer them.
• Step 12: Finally, they develop the integral skills involving optimal methods and best practices to produce useful outputs right from scratch, publish them in their ePortfolio and thereby proceed from emulation to self-expression, from self-expression to self-confidence and from self-confidence to self-reliance and self-esteem!
• Step 2: Learners are exposed to the specific tool(s) used in the course through the various real-life applications of the tool(s).
• Step 3: Learners are acquainted with the careers and the hierarchy of roles they can perform at workplaces after attaining increasing levels of mastery over the tool(s).
• Step 4: Learners are acquainted with the architecture of the tool or tool map so as to appreciate various parts of the tool, their functions, utility and inter-relations.
• Step 5: Learners are exposed to simple application development methodology by using the tool at the beginner’s level.
• Step 6: Learners perform the differential skills related to the use of the tool to improve the given ready-made industry-standard outputs.
• Step 7: Learners are engaged in appreciation of real-life case studies developed by the experts.
• Step 8: Learners are encouraged to proceed from appreciation to imitation of the experts.
• Step 9: After the imitation experience, they are required to improve the expert’s outputs so that they proceed from mere imitation to emulation.
• Step 10: Emulation is taken a level further from working with differential skills towards the visualization and creation of a complete output according to the requirements provided. (Long Assignments)
• Step 11: Understanding the requirements, communicating one’s own thoughts and presenting are important skills required in facing an interview for securing a work order/job. For instilling these skills, learners are presented with various subject-specific technical as well as HR-oriented questions and encouraged to answer them.
• Step 12: Finally, they develop the integral skills involving optimal methods and best practices to produce useful outputs right from scratch, publish them in their ePortfolio and thereby proceed from emulation to self-expression, from self-expression to self-confidence and from self-confidence to self-reliance and self-esteem!
Ready to start Data Visualization and Automation Strategies?
Join our upcoming batch at ZICA Kalyani center with certified instructors.
Other MKCL Courses
-

Data Entry and Data Management
120 hours -

Office Assistance
120 hours -

Google Workspace Expert
120 hours -
Advanced Data Entry Techniques
60 hours